A place to share and discuss data visualizations. #dataviz
(under new moderation as of 2024-01, please let me know if there are any changes you want to see!)
source
ht to @hilljam@mastodon.social
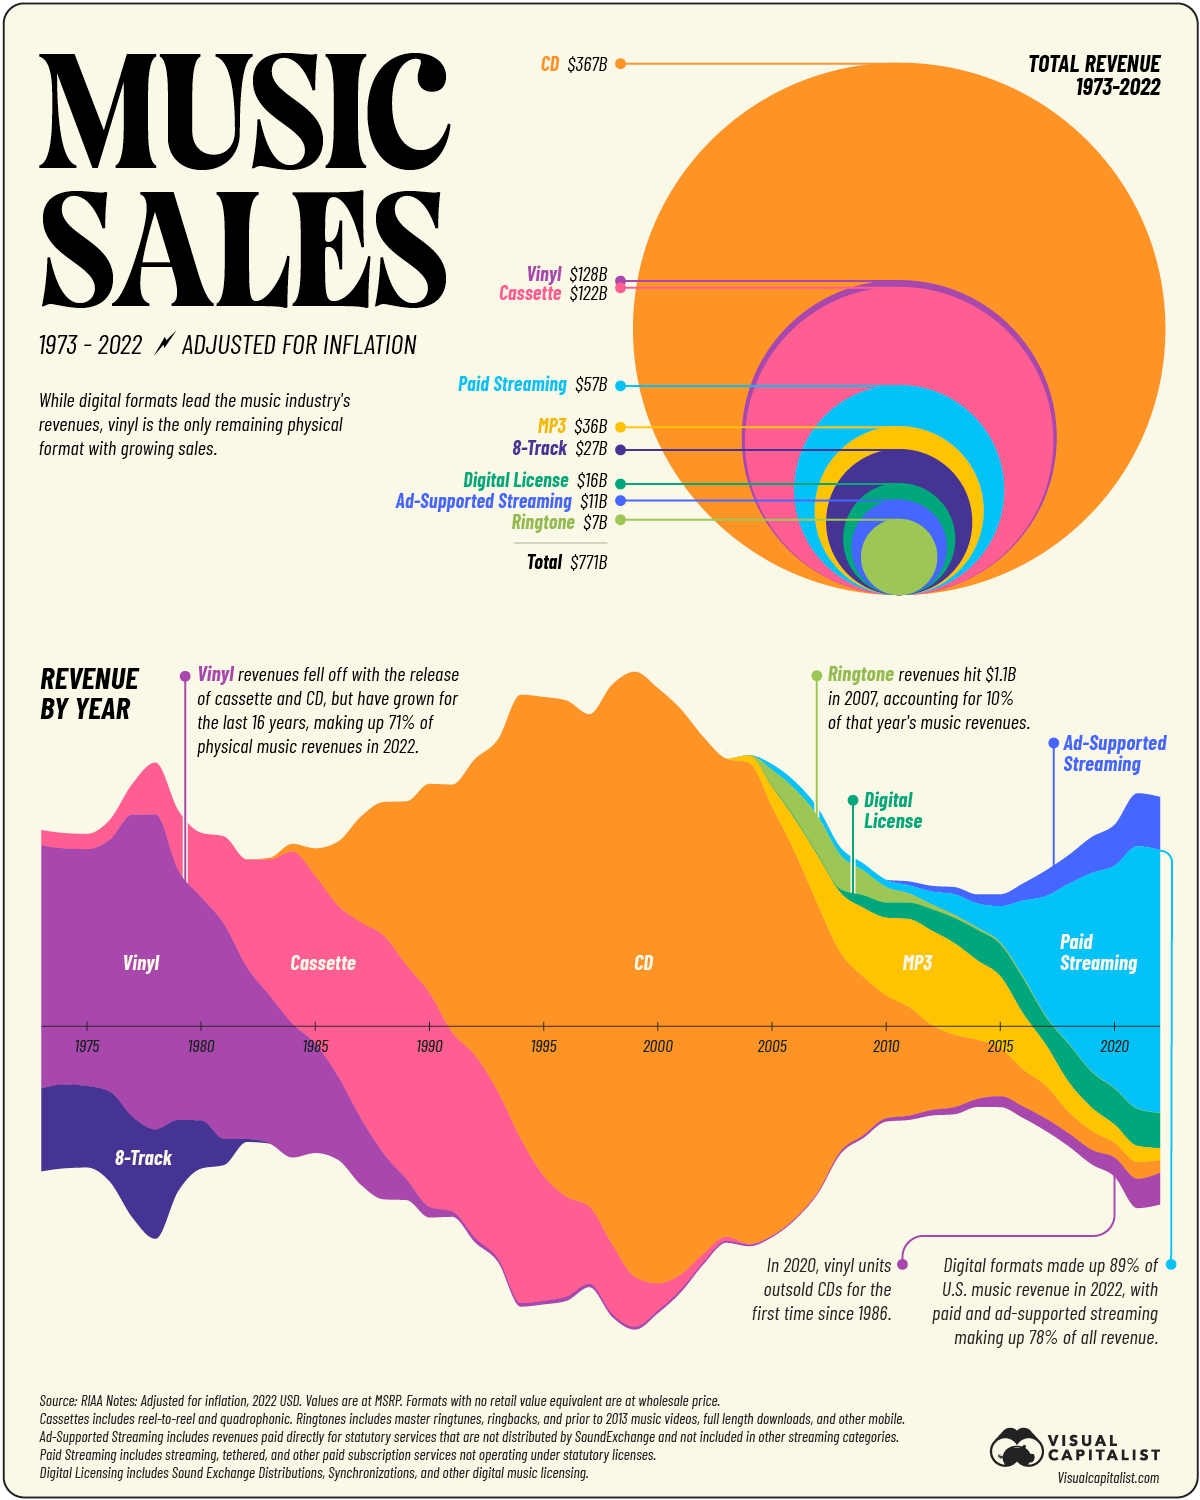
Probably because they wanted to show the variance over time which one pie chart cannot visually show. And it's easier to compare a circle vs a circle than a pie chart.
Probably because they wanted to show the variance over time which one pie chart cannot visually show. And it's easier to compare a circle vs a circle than a pie chart.