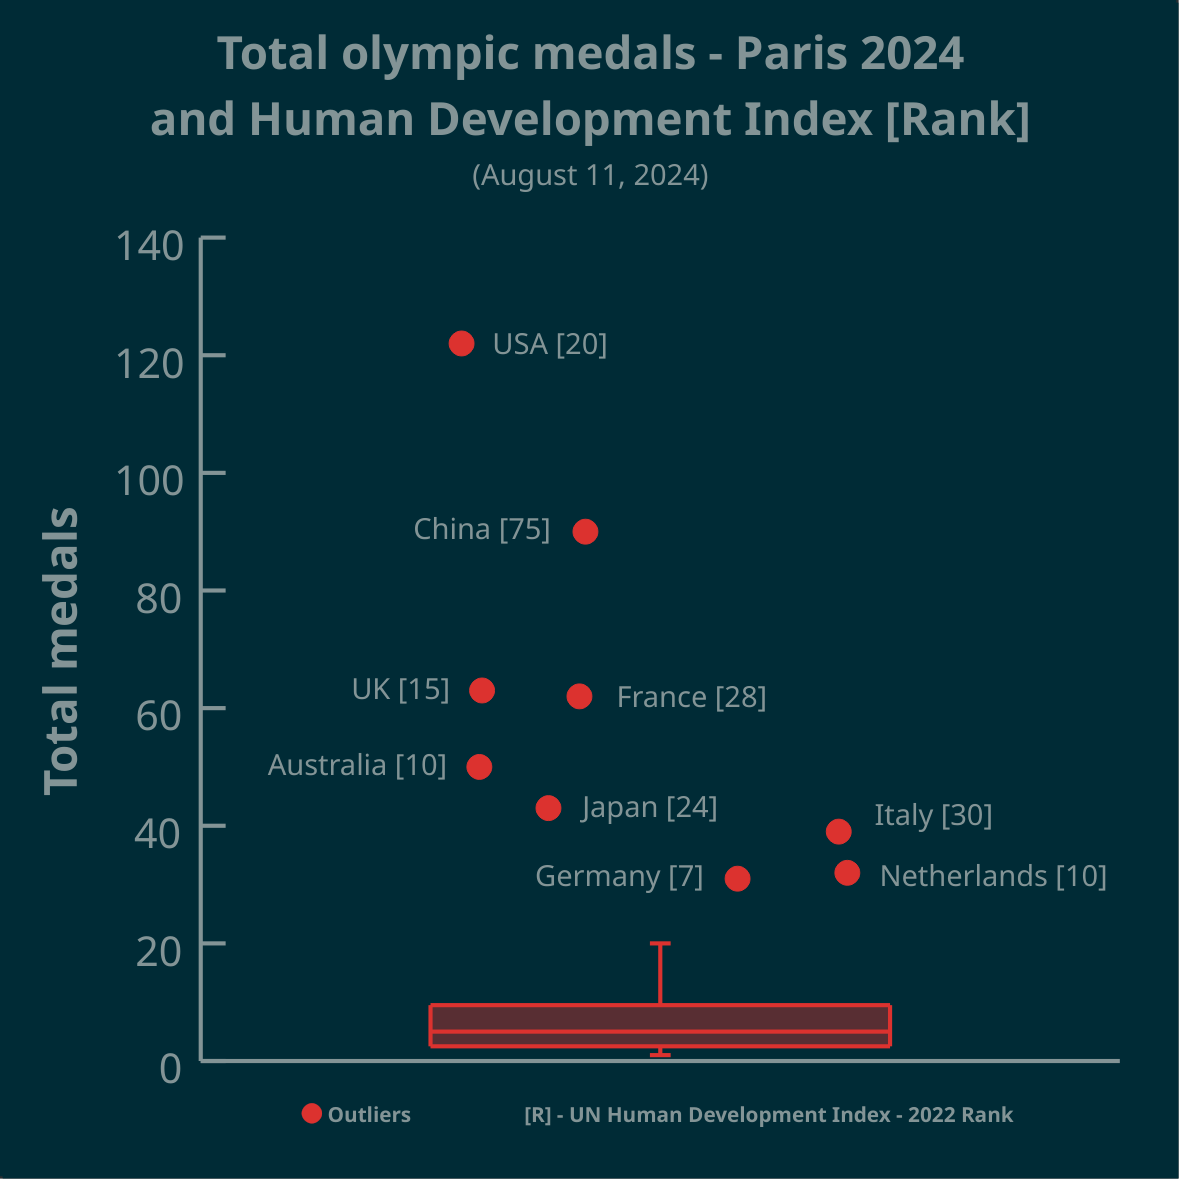
LabPlot

joined 2 years ago
[โ€“] LabPlot@floss.social 2 points 1 month ago* (last edited 1 month ago)

@dataisbeautiful

Thank you for all your comments. A jittering of data points along the x-axis was used to avoid over-plotting. But yes, a scatter plot with a boxplot attached along the y-axis (to show outliers) may be more informative in this case.

[โ€“] LabPlot@floss.social -5 points 1 month ago* (last edited 1 month ago) (2 children)

@clutchtwopointzero

A boxplot is a 1-dimensional plot. The data points are jittered along the x-axis to make them less crowded.

More on boxplots here:

โžก๏ธ https://labplot.kde.org/2021/08/11/box-plot/
โžก๏ธ https://userbase.kde.org/LabPlot/2DPlotting/BoxPlot


โ–ถ๏ธ Total olympic medals won in Paris 2024 and Human Development Index ๐Ÿ…

@dataisbeautiful

โžก๏ธ https://www.businesstimes.com.sg/opinion-features/what-olympic-medal-table-really-tells-us

After reading the article we made this #boxplot using #LabPlot, an open source data analysis and visualization software.

The plot doesn't provide answers, it rather invites some thinking.

#Olympics #Olympics2024 #France #China #USA #UnitedStates #UnitedKingdom #UK #Brazil #Australia #Japan #Italy #Canada #Germany #Italy #Netherlands #DataAnalysis #DataScience #OpenSource #FOSS

[โ€“] LabPlot@floss.social 3 points 1 month ago

@architectonas

We used #LabPlot, a free, open source and cross-platform data visualization and analysis software.

LabPlot's homepage:
โžก๏ธ https://labplot.kde.org/

Video tutorials:
โžก๏ธ https://www.youtube.com/@LabPlot/videos

[โ€“] LabPlot@floss.social 0 points 1 month ago (1 children)

@Eheran

Great question! And what's _your_ answer?

[โ€“] LabPlot@floss.social 2 points 1 month ago* (last edited 1 month ago)

@Sconrad122

Any exploratory plot forms a question and your comment shows how to look for answers. Thanks!

[โ€“] LabPlot@floss.social 1 points 1 month ago* (last edited 1 month ago)
[โ€“] LabPlot@floss.social 0 points 1 month ago (1 children)

@smeg

The points are jittered along the x-axis, otherwise the data points could overlap.

[โ€“] LabPlot@floss.social 1 points 1 month ago* (last edited 1 month ago) (1 children)

@NOT_RICK

Australia is the next country after Ethiopia, but it's not outlier in this case.

[โ€“] LabPlot@floss.social 1 points 1 month ago* (last edited 1 month ago)
 

โ–ถ๏ธ Total olympic medals per 1k $GDP per capita - Paris 2024 - represented in the Tukey's boxplot ๐Ÿ…

@dataisbeautiful

Is the highest number, relative to $GDP per capita, best? Outliers marked as circles. Made in #LabPlot, an open-source data analysis and visualization software.

Edit: the problem is framed as a question.

#Olympics #Olympics2024 #France #China #NorthKorea #USA #UnitedStates #UnitedKingdom #UK #Brazil #Australia #Japan #Italy #Canada #Germany #Spain #DataAnalysis #DataViz

[โ€“] LabPlot@floss.social 12 points 8 months ago (1 children)

@nikoof

Our Christmas tree includes a test to check if our readers are humans ๐Ÿ˜‰

[โ€“] LabPlot@floss.social 21 points 8 months ago (1 children)

@zkfcfbzr @opensource

Let's just assume that the Christmas tree includes a test to check if our readers are humans ๐Ÿ™‚


Merry Christmas from the LabPlot team! ๐ŸŽ… ๐ŸŽ„

@opensource @kde
#Christmas #FOSS #FLOSS #OpenSource #KDE #LabPlot #DataScience #DataViz

17
submitted 8 months ago* (last edited 8 months ago) by LabPlot@floss.social to c/dataisbeautiful@lemmy.ml
 

Using Zipf's Law to detect outliers in median age of European Countries in #LabPlot (2023 est.)

@dataisbeautiful

LabPlot โค๏ธ Data

โžก๏ธ https://en.wikipedia.org/wiki/Zipf%27s_law

#DataAnalysis #DataScience #Data #DataViz #Visualization #Plotting #Statistics #Age #Europe #FOSS #OpenSource

[โ€“] LabPlot@floss.social 3 points 10 months ago* (last edited 10 months ago) (1 children)

@dataisbeautiful !health@lemmy.world !labplot@lemmy.kde.social
@Generous1146

Actually, it looks more like the disability-free life expectancy has increased in 2015 and since then stays at about the same level.

#DataViz #Statistics #Visualization #Health #Disability #LabPlot #OpenSource #FOSS

42
submitted 10 months ago* (last edited 10 months ago) by LabPlot@floss.social to c/dataisbeautiful@lemmy.ml
 

Is there a causal relationship between electricity consumption and obesity, or is it just an illusory correlationโ“

@science @dataisbeautiful @health

The plot and curve fitting made in @LabPlot, a FREE, open source Data Visualization and Analysis software. It works on #Windows, #Linux and #macOS.

โžก๏ธ https://labplot.kde.org/download

#Data compiled for 184 countries.

#FOSS #FLOSS #OpenSource #FreeSoftware #DataViz #Visualization #Obesity #Health #ClimateChange #ClimateCrisis #Climate #Food

view more: next โ€บ