this post was submitted on 22 Dec 2024
78 points (86.1% liked)

Map Enthusiasts

3606 readers
249 users here now

For the map enthused!

Rules:

founded 2 years ago
MODERATORS
you are viewing a single comment's thread
view the rest of the comments
[–] MNByChoice@midwest.social 4 points 3 days ago* (last edited 3 days ago)

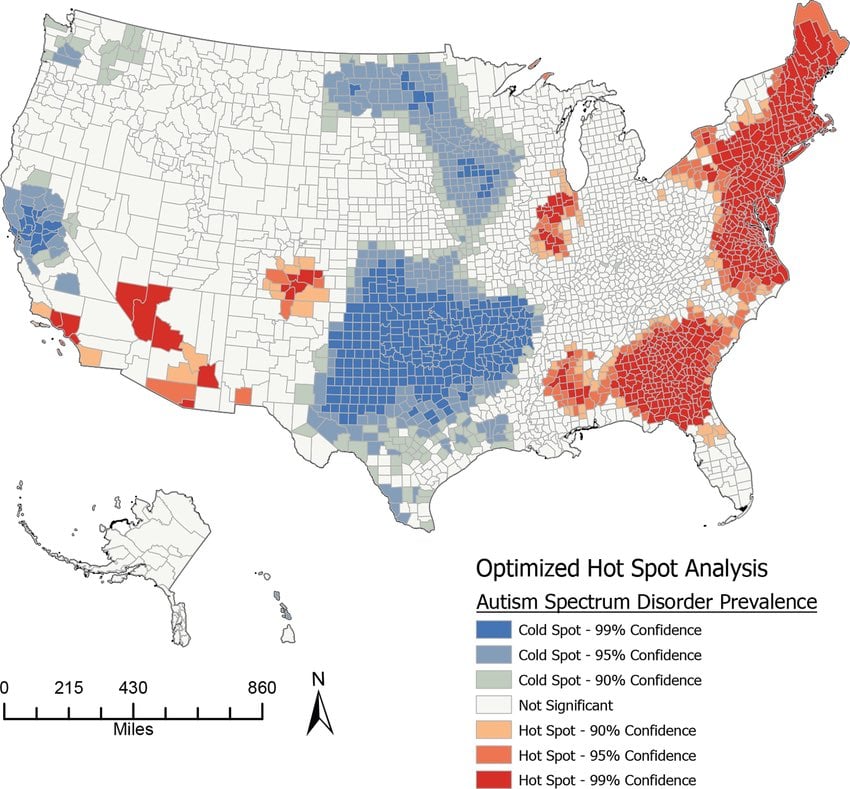
Prevalence estimates of autism spectrum disorder (ASD) point to geographic and socioeconomic disparities in identification and diagnosis. Estimating national prevalence rates can limit understanding of local disparities, especially in rural areas where disproportionately higher rates of poverty and decreased healthcare access exist. Using a small area estimation approach from the 2016–2018 National Survey of Children’s Health (N = 70,913), we identified geographic differences in ASD prevalence, ranging from 4.38% in the Mid-Atlantic to 2.71% in the West South-Central region. Cluster analyses revealed “hot spots” in parts of the Southeast, East coast, and Northeast. This geographic clustering of prevalence estimates suggests that local or state-level differences in policies, service accessibility, and sociodemographics may play an important role in identification and diagnosis of ASD. County-Level Prevalence Estimates of Autism Spectrum Disorder in Children in the United States.

https://www.researchgate.net/publication/370523386_County-Level_Prevalence_Estimates_of_Autism_Spectrum_Disorder_in_Children_in_the_United_States