Meanwhile in Germany:

News/Interesting Stories/Beautiful Pictures from Europe 🇪🇺
(Current banner: Thunder mountain, Germany, 🇩🇪 ) Feel free to post submissions for banner pictures
(This list is obviously incomplete, but it will get expanded when necessary)
Also check out !yurop@lemm.ee
Meanwhile in Germany:
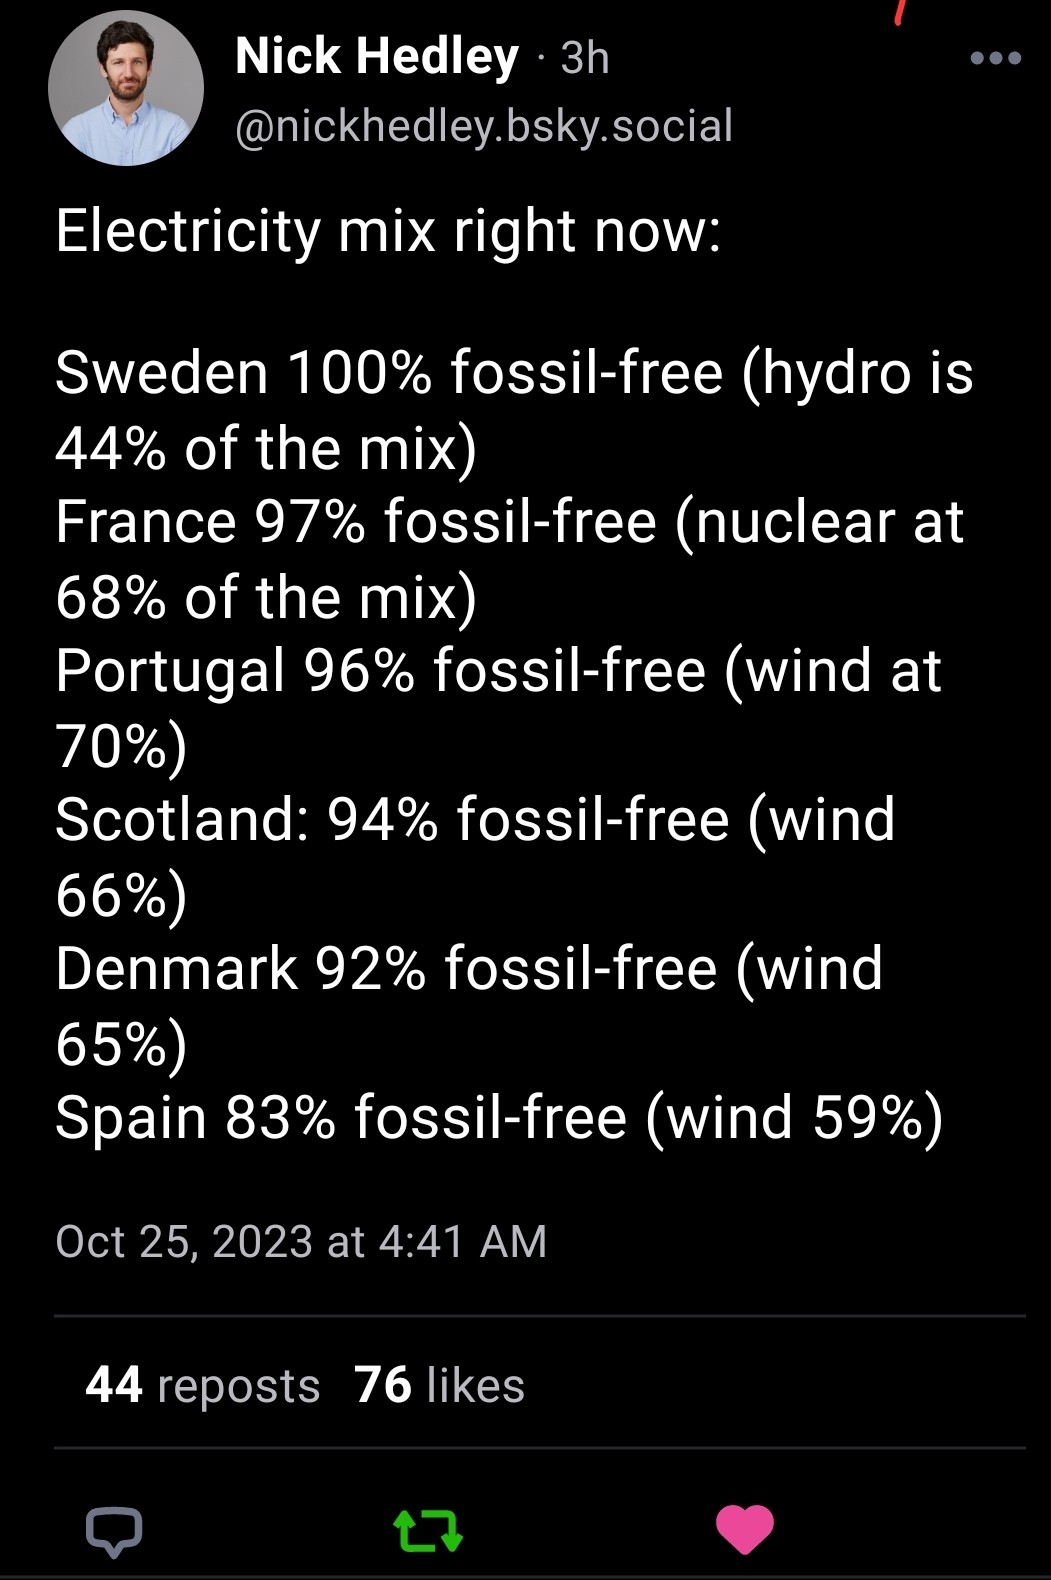
You are comparing apples to oranges, Germany also has times where we use 100% renewables.
You cant just compare momentary data to averages
"has times where we use 100% renewables. You cant just compare momentary data to averages"
Then feel free to cite averages instead ¯\(ツ)/¯
https://ec.europa.eu/eurostat/web/products-eurostat-news/-/ddn-20220126-1
It's just a quick web search, but there are the EU countries listed with their avg. renewable electricity 2021.
As mentioned, the momentary data isn't worth much. There are bad days with only 20% renewable electricity and there are good days with 120% renewable-only generation compared to the load. For years, European electricity prices turn negative on those days, as renewables alone in Germany generate 10TW more than the load.
That's why annual average is important and not to single out good or bad days pretending this is the norm.
Renewables are a means to an end, not the main objective. That's CO2 reduction. To that end, the relevant data is average carbon intensity. So I'd say this is a more relevant graph: https://ourworldindata.org/grapher/carbon-intensity-electricity?time=latest®ion=Europe
ITS SO BROKEN LOL
What's going on?
the character series AMPERSAND, R, E, G gets rewritten as the "registered trademark" symbol
®
Renewables are a means to an end, not the main objective. That's CO2 reduction. To that end, the relevant data is average carbon intensity. So I'd say this is a more relevant graph: https://ourworldindata.org/grapher/carbon-intensity-electricity?time=latest®ion=Europe